The In-game Part Ranking chart is slightly misleading. The actual 3D Mark performance rank of some cards are lower than they appear in the chart. Here are some helpful charts with more accurate numbers.
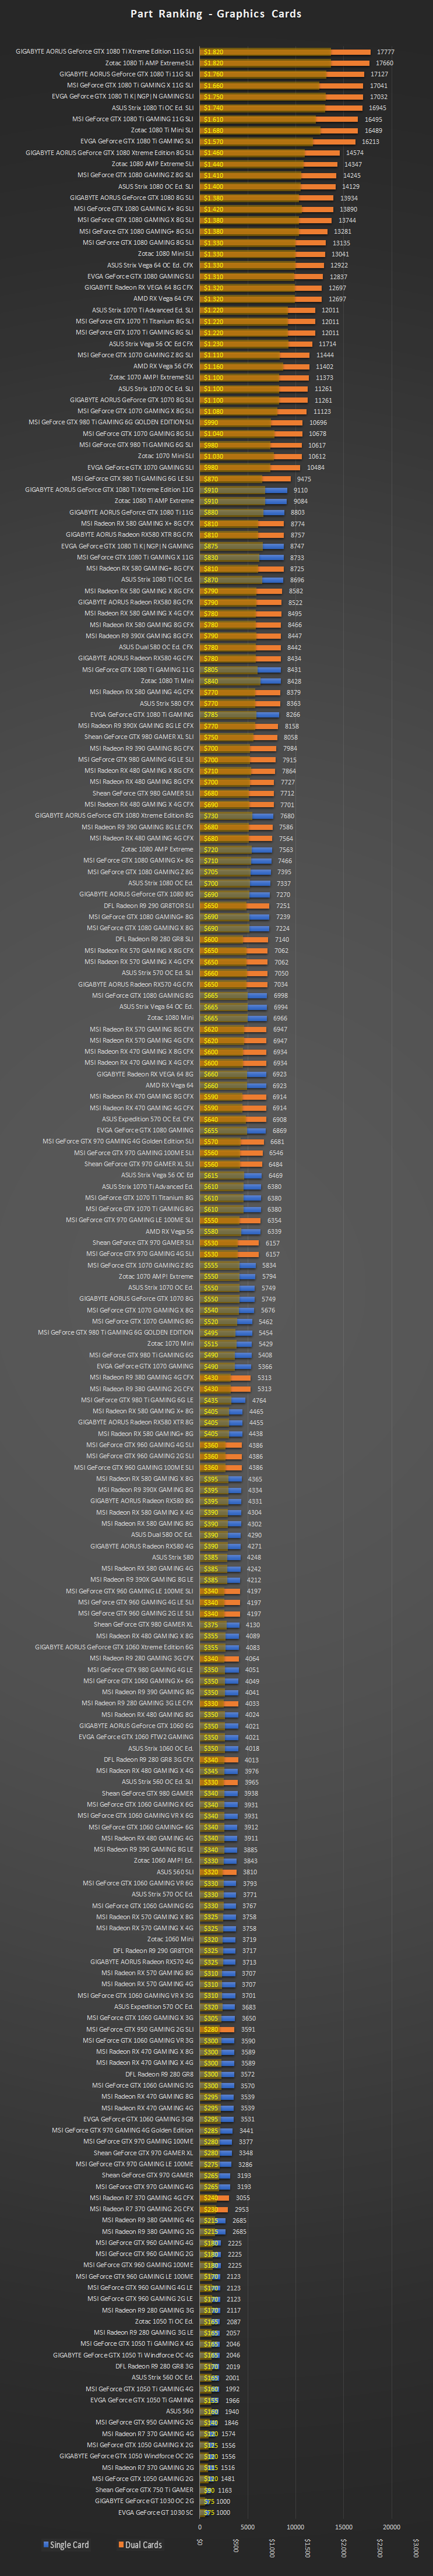
Part Ranking – Graphics Cards
- This is the Part Ranking chart for SLI/CrossFire cards alongside single cards.
- The chart here is rearranged according to actual performance numbers.
- SLI/CrossFire configurations and costs are marked for ease of use.
The SLI/CFX notation denotes 2 cards of the same type in SLI or CrossFire configuration.
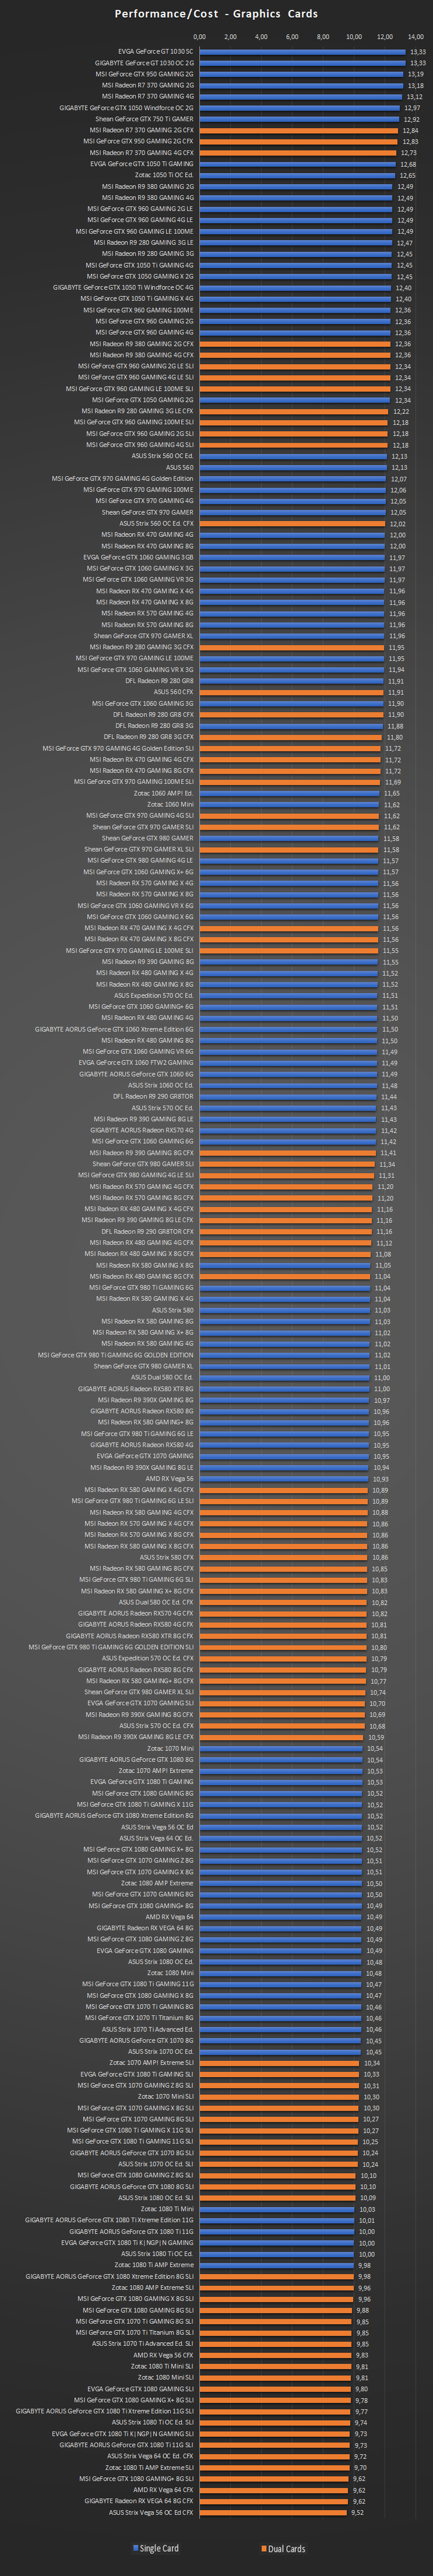
Performance/Cost – Graphics Cards
- This is the Performance/Cost chart for all GPU configurations.
- The chart here is rearranged according to actual performance numbers.
- SLI/CrossFire configurations are marked for ease of use.
- The higher the value, the better cost-benefit you’re getting!
The SLI/CFX notation denotes 2 cards of the same type in SLI or CrossFire configuration.
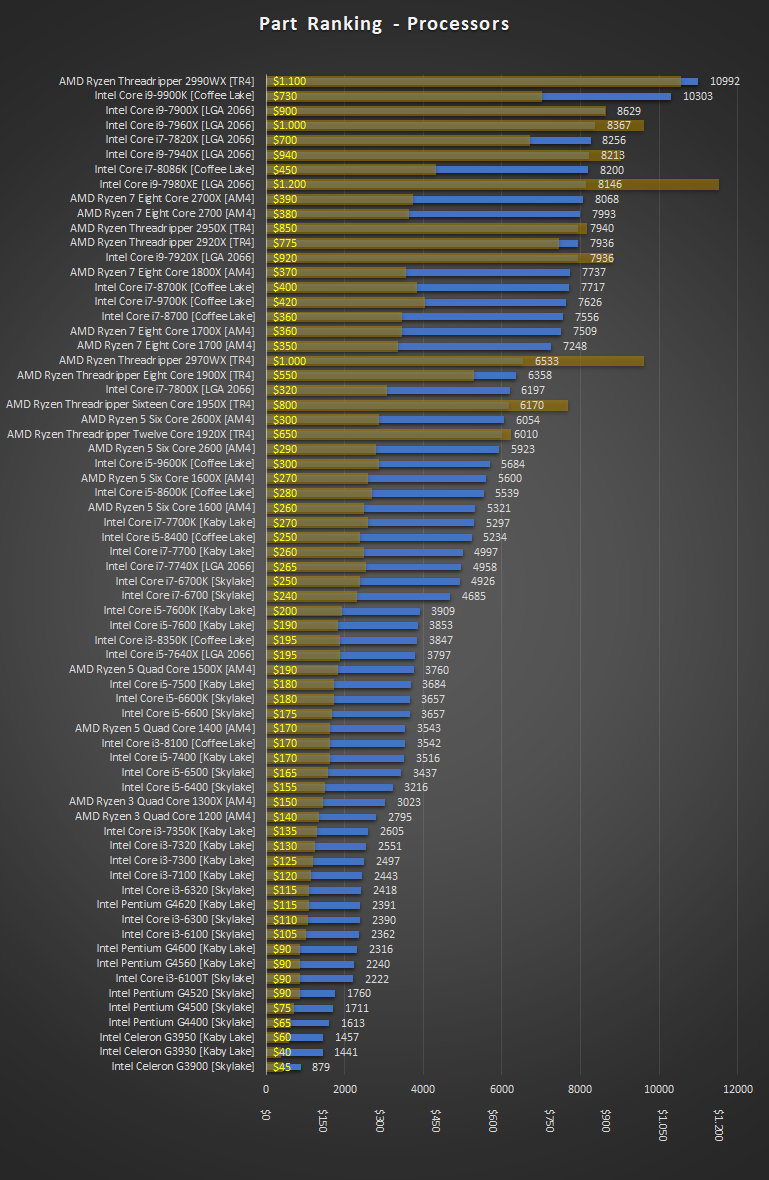
Part Ranking – Processors
- This is the Part Ranking chart for all CPUs.
- The chart here is rearranged according to actual performance numbers.
- This does not take into account RAM configurations. This is only performance values of the CPUs.
- RAM setup is 2x 2133 MHz.
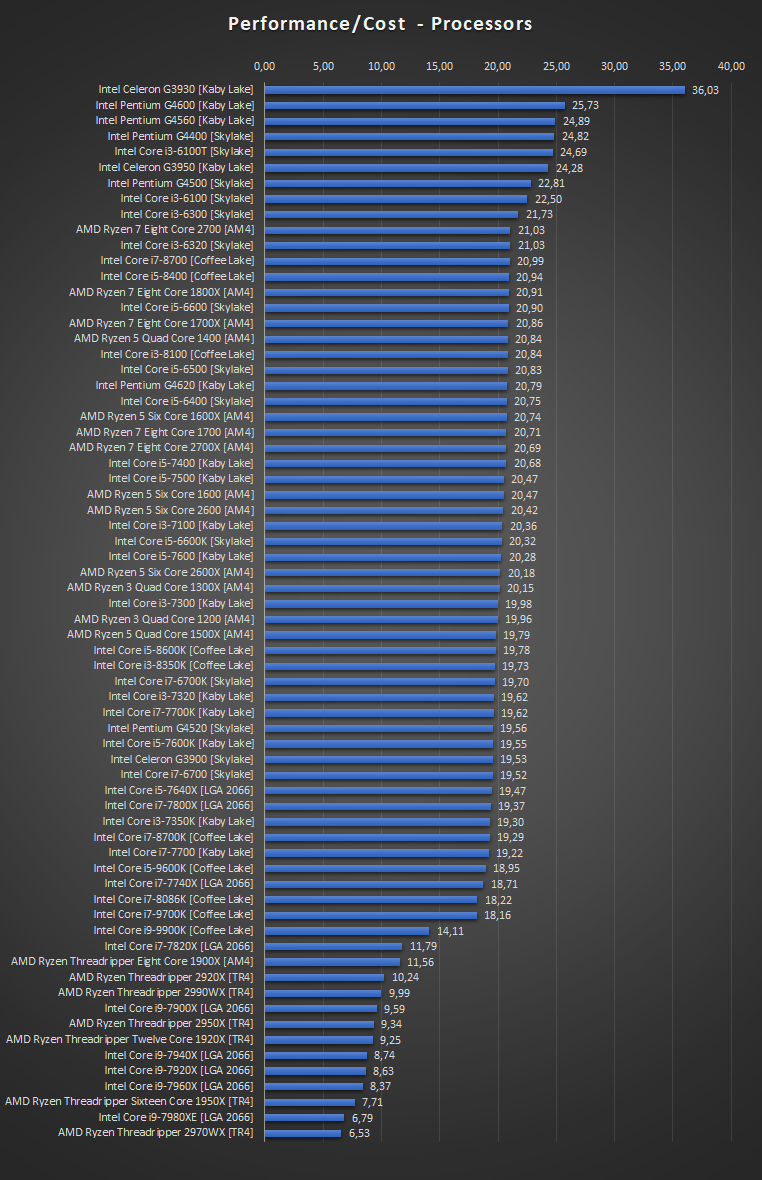
Performance/Cost – Processors
- This is the Performance/Cost chart for all CPUs.
- The chart here is rearranged according to actual performance numbers.
- This does not take into account RAM configurations. This is only performance values of the CPUs.
- RAM setup is 2x 2133 MHz.
- The higher the value, the better cost-benefit you’re getting!
RAM – Is it worth it? (still v0.7.10.1)
- This is the RAM Configuration and Price Ranking.
- Ordered according to price of the configuration.
- Price is only the combination of the CPU and RAM.
- Graphics card, motherboard*, harddisk, power supply and cooler does not affect the performance.
- *The Z370 FTW, Z270 FTW K and Z270 Classified K allows for up to 3600 MHz
RAM selected is the cheapest RAM of the select frequency:
- 2133 MHz = $ 20
- 2400 MHz = $ 40
- 2666 MHz = $ 45
- 2800 Mhz = $ 50
- 3000 Mhz = $ 55
- 3200 Mhz = $ 65
- 3600 Mhz = $ 125
- 3733 Mhz = $ 135
- 4000 Mhz = $ 80
- 4133 Mhz = $ 160
- 4266 Mhz = $ 180
- 4400 Mhz = $ 220
- 4600 Mhz = $ 280
- 4700 Mhz = $ 370
How to use this chart:
Select your price range and then look for the best configuration for your money.
This chart is to show you whether it’s worth it, putting more money into RAM or if you should select the better CPU.

Performance/Cost – RAM & Processor (still v0.7.10.1)
- This is the Performance/Costs chart for RAM configurations.
- Ordered according to performance per buck of the configuration.
- Price is only the combination of the CPU and RAM.
This chart is to show you whether it’s worth it, putting more money into RAM or if you should select the next CPU.
